- Visibility 57 Views
- Downloads 13 Downloads
- DOI 10.18231/j.ijceo.2020.044
-
CrossMark
- Citation
To study the correlation between the pressure-to-cornea index and both structural and functional measures of glaucoma
- Author Details:
-
Shail Shah
-
Rajni Sethia *
-
R N Kothari
-
Aakash Patel
-
Hushedar Kharas
Introduction
Glaucoma is a multifactorial disease with a characteristic damage to the optic nerve with or without increasing in intra-ocular pressure and definite visual field deformities.[1] Elevated IOP is the most significant modifiable risk factor along with other risk factors like family history, race, age older than 40 years, myopia, diabetes mellitus and hypertension.[2], [3], [4], [5] Measurement of intra-ocular pressure is influenced by Central corneal thickness. Also there may not be a linear relationship between applanation IOP and CCT.[6] To find an alternative indication, few researches have taken into account IOP and CCT as single risk factor and have coined the term Pressure to Cornea Index.[7] PCI is a simple method where the values of IOP and CCT are both important. The study focuses on importance of PCI in structural and functional measurement of glaucoma.
Materials and Methods
This was a cross-sectional and comparative study conducted in the Department of Ophthalmology of a tertiary care hospital. After receiving approval from the institutional Ethics Committee, a total of 25 ocular hypertensive eyes(Group 1), 25 primary open angle glaucoma eyes(Group 2), 25 eyes of normal tension glaucoma(Group-3) and 25 control eyes(Group 4) were enrolled in the study after taking informed consent. All patients were aged between 37 and 71 years. The study also adhered to the tenets of Declaration of Helsinki.
A detailed careful history and complete ophthalmic examination was done which included recording Uncorrected visual acuity (UCVA) and Best corrected visual acuity (BCVA) by using Snellen’s chart, slit lamp examination and gonioscopy (Zeiss four mirror). IOP was determined with Goldmann applanation tonometer (AATM-5001) and Ultrasonic pachymeter (SONOMED PACSCAN 300P) was used to measure the CCT by the same observer and an average of three consecutive readings was taken. Dilated fundus examination was done with slit lamp biomicroscopy (using 90D and 78D Zeiss lens). Visual field was done with Humphrey’s automated static Perimetry using SITA standard algorithm and 24-2 program.
Results


| IOP | p value | |||
| N | Mean | SD | ||
| Normal | 25 | 14.92 | 2.414 | 0.000 |
| NTG | 25 | 14.04 | 1.513 | |
| OHT | 25 | 24.88 | 1.943 | |
| POAG | 25 | 25.72 | 3.530 | |
| Total | 100 | 19.89 | 5.971 |
The value IOP measured by GAT is shown in [Table 1]. On comparison of IOP values of four groups, the difference is statistically significant. The mean IOP measured by GAT in normal group was 14.92 ± 2.41, NTG group was 14.04 ± 1.51, OHT group was 24.88 ± 1.94 and POAG group was 25.72 ± 3.53. The values of IOP in Controls and NTG group is within normal limits i.e. <21 mmhg and that of OHT and POAG groups is >21 mmhg.
| Descriptives – CCT (in mm) | p value | ||||||
| N | Mean (mm) | SD | 95% Confidence Interval for Mean | ||||
| Lower Bound | Upper Bound | ||||||
| Pachymetry | Normal | 25 | 0.55 | 0.03 | 0.535 | 0.557 | 0.000 |
| NTG | 25 | 0.49 | 0.02 | 0.478 | 0.499 | ||
| OHT | 25 | 0.58 | 0.02 | 0.574 | 0.588 | ||
| POAG | 25 | 0.52 | 0.03 | 0.508 | 0.534 | ||
| Total | 100 | 0.53 | 0.04 | 0.526 | 0.542 |
CCT is shown in [Table 2]. CCT values of 4 groups after comparing , the difference is statistically significant. The mean CCT in normal group was 0.55 ± 0.03, NTG group was 0.49 ± 0.02, OHT group was 0.58 ± 0.02 and POAG group was 0.52 ± 0.04.
| Descriptives | p value | ||||||
| N | Mean | SD | 95% Confidence Interval for Mean | ||||
| Lower Bound | Upper Bound | ||||||
| PCI | Normal | 25 | 91.22 | 8.46 | 87.725 | 94.705 | 0.000 |
| NTG | 25 | 120.74 | 10.18 | 116.534 | 124.940 | ||
| OHT | 25 | 127.69 | 16.85 | 120.737 | 134.648 | ||
| POAG | 25 | 182.13 | 16.71 | 175.228 | 189.025 | ||
| Total | 100 | 130.44 | 35.61 | 123.378 | 137.508 |
PCI is shown in [Table 3]. On comparison of PCI values of four groups, the difference is statistically significant. The mean PCI in normal group was 91.22 ± 8.46, NTG group was 120.74 ± 10.18, OHT group was 127.69 ± 16.85 and POAG group was 182.13 ± 35.61.
| Coefficientsa | ||||||
| Model | Unstandardized Coefficients | Standardized Coefficients | t | p value | ||
| B | SE | Beta | ||||
| 1 | (Constant) | 107.442 | 4.603 | 23.342 | .000 | |
| Disc (CDR) | 39.657 | 6.044 | .552 | 6.561 | .000 |
| tCoefficient | |||||
| Unstandardized Coefficients | Standardized Coefficients | t | Sig. | ||
| Std. Error | Beta | ||||
| (Constant) | 32.720 | 58.108 | 0.563 | 0.575 | |
| Mean Deviation | -2.196 | 0.524 | -0.507 | -4.189 | 0.000 |

Discussion
Many studies have shown that the central corneal thickness (CCT) is an important parameter which influences the accuracy of tonometric readings and our decision‐making in the management of glaucoma.[8], [9], [10], [11] CCT affects the IOP measurement by various tonometers, and mainly the Goldmann applanation tonometer, where thin corneas lead to an underestimation and thick corneas to an overestimation of the true IOP.[12], [13], [6], [14], [15], [16]
CCT values have shown difference in individuals with NTG, POAG and OHT. Anupama C. Shetgar[17] et al. performed a study to compare the Central Corneal Thickness (CCT) of Normal Tension Glaucoma (NTG) with those of Primary Open Angle Glaucoma (POAG) and Ocular Hypertension (OHT). They concluded that the central corneal thickness was significantly lower in the normal tension glaucoma patients as compared to those in the controls and in the primary open angle glaucoma patients, whereas the ocular hypertension patients had significantly higher central corneal thicknesses than the controls and the primary open angle glaucoma patients. No significant difference was found between the primary open angle patients and the controls.
Copt RP et al.[18] performed a similar study and found that here was no significant difference in CCT between controls and patients with POAG, but the CCT in the group with NTG was significantly lower than that in the control group or the group with POAG (P < .001), and the CCT in the group with OHT was significantly higher than in controls or patients with POAG (P < .001).
There was a significantly similar difference between the CCT among individuals with NTG, OHT and POAG in our study. CCT in NTG group (0.49 mm ± 0.02) was significantly lower than POAG (0.52 mm ± 0.03), OHT (0.58 mm ± 0.02) and normal individuals (0.55 mm ± 0.03). Also the CCT in OHT group was significantly higher than POAG, NTG and normal individuals. (P value 0.0000). However unlike above studies we found significant difference between CCT in POAG and normal group. In the POAG group the CCT was significantly lower than that in normal group. (p value 0.005). We were unable to find the reason for this disparity.
Ilive et al. proposed a new index called Pressure to Cornea Index in order to integrate IOP and CCT into unified risk factor. A ratio of untreated IOP and CCT3 in mm was defined as PCI. Investigation of PCI distribution in 220 normal controls, 76 with ocular hypertension (OHT), 53 patients with normal tension glaucoma (NTG) and 89 with primary open‐angle glaucoma (POAG) was done. Mean PCI values were: Controls 92.0 (SD 24.8), NTG 129.1 (SD 25.8), OHT 134.0 (SD 26.5), and POAG 173.6 (SD 40.9).
A range of 120-140 was concluded to be a normal upper limit of PCI, 120 being the cut‐off value for eyes with untreated pressures ⩽21 mm Hg and 140 when untreated pressure ⩾22 mm Hg. It was proposed that at a given IOP level PCI might reflect an individual susceptibility, and so can be considered as a risk factor for glaucoma.
In Our study results showed, Mean PCI values of Controls 91.22 (SD 8.46), NTG 120.74 (SD 10.18), OHT 127.69 (SD 16.85), and POAG 182.13 (SD 16.71). The difference among the group was statistically significant except that the difference between NTG group and OHT group was not significant. (p value 0.441) This result is also in accordance with the parent study. Such significance was least desired between OHT and NTG group as clinically, after the untreated pressure has been established, differential diagnosis is usually made between NTG and normality, and between POAG and OHT.
Moving a step ahead we in our study tried to find out possible uses of PCI as a parameter to know about the severity of the disease. In an attempt to do so, a comparison was done between PCI and the structural (C/D ratio) and functional (MD and PSD) measures of glaucoma.
Franco et al.[19] in their study correlated PCI with C/D ratio, MD and PSD. 72 eyes of 36 patients were included. All the patients included had raised IOP (Either POAG or OHT). We have included controls as well as NTG group in our study. We evaluated that the PCI can be possibly used as a glaucoma risk factor as well as a parameter for disease severity. We also belive that if we take into account all 4 groups, the probability of PCI being used as a parameter for disease severity is enhanced.
Our results show a good linear correlation between the PCI and the C/D ratio. Higher PCI values were seen in patients with higher C/D ratio.
Higher PCI values were seen in patients with lower MD. We found statistically significant correlation when MD and PCI were compared. Similar result was also seen in study done by Franco et al.
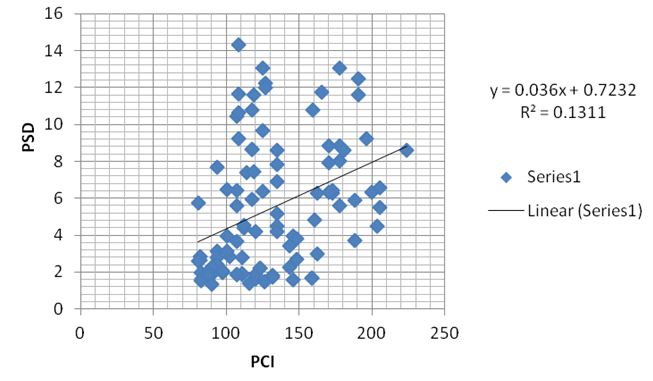
Higher PSD correlated to more damaged visual field, higher PSD would have a higher PCI value. In our study a positive correlation between PSD and PCI was established, though not statistically significant. We attribute the insignificance to selection of the patient. As PSD is not expected to rise in very advanced cases of glaucoma where there is generalized depression of the field, it may not reflect the severity of glaucoma in such cases. However a negative correlation was found between PSD and PCI in a study by Franco et al.[19] Limitation of their study was sample size and bias in selection.
Limitation of the study include consideration of only C/D ratio for structutal damage as it is not a definitive sign of glaucoma owing to relative disc size, quantitative assessment of neuro-retinal rim and inter-observational discrepancy. However better technology is now available to assess the structural damage of disc.
Our study is a cross sectional study. Further longitudinal studies are warranted on the subject to explore other possible uses of PCI and strengthen its role as a unified risk factor and indicator of glaucoma severity. Other possible uses that can be explored are its use in glaucoma progression and thereafter in decision making of target pressure on the basis of PCI.
Source of Funding
None.
Conflict of Interest
None.
References
- Constantin-Dan Bordeianu. A new classification of glaucomas. Clinical Ophthalmol 2014. [Google Scholar]
- Renuka Bathija, Neeru Gupta, Linda Zangwill, Robert N. Weinreb. Changing Definition of Glaucoma. J Glaucoma 1998. [Google Scholar]
- M A Kass, D K Heuer, E J Higginbotham. The ocular hypertension treatment study: a randomized trial determines that topical hypotensive medication delays or prevents the onset of primary open-angle glaucoma. Arch Ophthalmol 2002. [Google Scholar]
- M C Leske, A Heijl, M Hussein. for the Early Manifest Glaucoma Trial Group. Factors for glaucoma progression and the effect of treatment. Arch Ophthalmol 2003. [Google Scholar]
- R Thomas, S Korah, J Muliyil. The role of central corneal thickness in the diagnosis of glaucoma. Indian J Ophthalmol 2000. [Google Scholar]
- Y C Ko, C J l Liu, W M Hsu. Varying Effects of Corneal Thickness on Intraocular Pressure Measurements with Different Tonometers. Eye 2005. [Google Scholar]
- M. E Iliev, A. Meyenberg, E. Buerki, G. Shafranov, M B. Shields. Novel pressure-to-cornea index in glaucoma. Br J Ophthalmol 2007. [Google Scholar]
- Sunil Shah, Anupam Chatterjee, Manoj Mathai, Simon P Kelly, Jeff Kwartz, David Henson. Relationship between corneal thickness and measured intraocular pressure in a general ophthalmology clinic11The authors have no proprietary interest in the development or marketing of any pachymeter.. Ophthalmol 1999. [Google Scholar]
- M O Gordon, J A Beiser, J Brandt. The Ocular Hypertension Treatment Study: baseline factors that predict the onset of primary open-angle glaucoma. Arch Ophthalmol 2002. [Google Scholar]
- Mitsugu Shimmyo, Anna J Ross, Anna Moy, Ramin Mostafavi. Intraocular pressure, Goldmann applanation tension, corneal thickness, and corneal curvature in Caucasians, Asians, Hispanics, and African Americans. Am J Ophthalmol 2003. [Google Scholar]
- H. Goldmann, Th. Schmidt. Über Applanationstonometrie. Ophthalmol 1957. [Google Scholar]
- K H Mok, C S Wong, V W Lee. Tono-pen tonometer and corneal thickness. Eye 1999. [Google Scholar]
- T Matsumoto, H Makino, H Uozato. The influence of corneal thickness and curvature on the difference between IOP measurements obtained with a non-contact tonometer and those with a Goldmann applanation tonometer. Nippon Ganka Gakkai Zasshi 2000. [Google Scholar]
- P-A Tonnu. The influence of central corneal thickness and age on intraocular pressure measured by pneumotonometry, non-contact tonometry, the Tono-Pen XL, and Goldmann applanation tonometry. Br J Ophthalmol 2005. [Google Scholar]
- Aoife Doyle, Yves Lachkar. Comparison of Dynamic Contour Tonometry With Goldman Applanation Tonometry Over a Wide Range of Central Corneal Thickness. J Glaucoma 2005. [Google Scholar]
- N Ehlers, T Bramsen, S Sperling. Applanation tonometry and central corneal thickness. Acta Ophthalmol 1975. [Google Scholar]
- Anupama C. Shetgar. The central corneal thickness in normal tension glaucoma, primary open angle glaucoma and ocular hypertension. J Clin Diagn Res 2013. [Google Scholar]
- René-Pierre Copt. Corneal Thickness in Ocular Hypertension, Primary Open-angle Glaucoma, and Normal Tension Glaucoma. Arch Ophthalmol 1999. [Google Scholar]
- Niro Kasahara, Andrea MBV Franco. Correlation between the pressure-to-cornea index and both structural and functional measures of glaucoma. Indian J Ophthalmol 2014. [Google Scholar]
